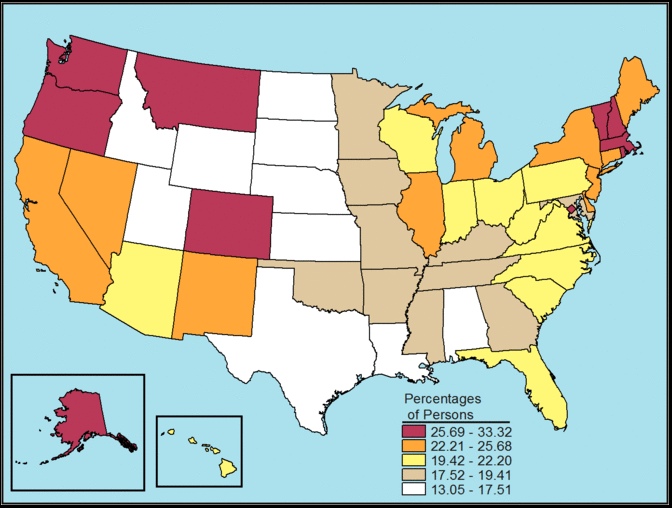
This map shows illicit drug use in the past month among persons aged 18 to 25, by State: percentages, annual averages based on 2011 and 2012 NSDUHs. States listed here in alphabetical order within each group were divided into five groups based on the magnitude of their percentages.
- States in the highest group (25.69 to 33.32 percent) were Alaska, Colorado, District of Columbia, Massachusetts, Montana, New Hampshire, Oregon, Rhode Island, Vermont, and Washington.
- States in the next highest group (22.21 to 25.68 percent) were California, Connecticut, Delaware, Illinois, Maine, Michigan, Nevada, New Jersey, New Mexico, and New York.
- States in the midgroup (19.42 to 22.20 percent) were Arizona, Florida, Hawaii, Indiana, North Carolina, Ohio, Pennsylvania, South Carolina, Virginia, West Virginia, and Wisconsin.
- States in the next lowest group (17.52 to 19.41 percent) were Arkansas, Georgia, Iowa, Kentucky, Maryland, Minnesota, Mississippi, Missouri, Oklahoma, and Tennessee.
- States in the lowest group (13.05 to 17.51 percent) were Alabama, Idaho, Kansas, Louisiana, Nebraska, North Dakota, South Dakota, Texas, Utah, and Wyoming.
Source: SAMHA.gov


